Shiken uses powerful analytics to analyse your progress in the platform and provide you with insights to help you improve and comparative data against your peers and the anonymised averages across the platform.
The progress area can be accessed from the main navigation menu on mobile and web.
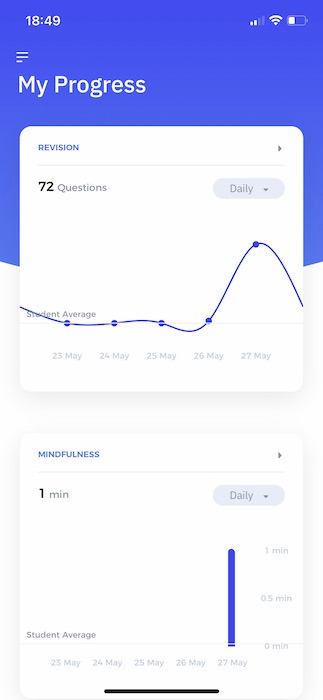
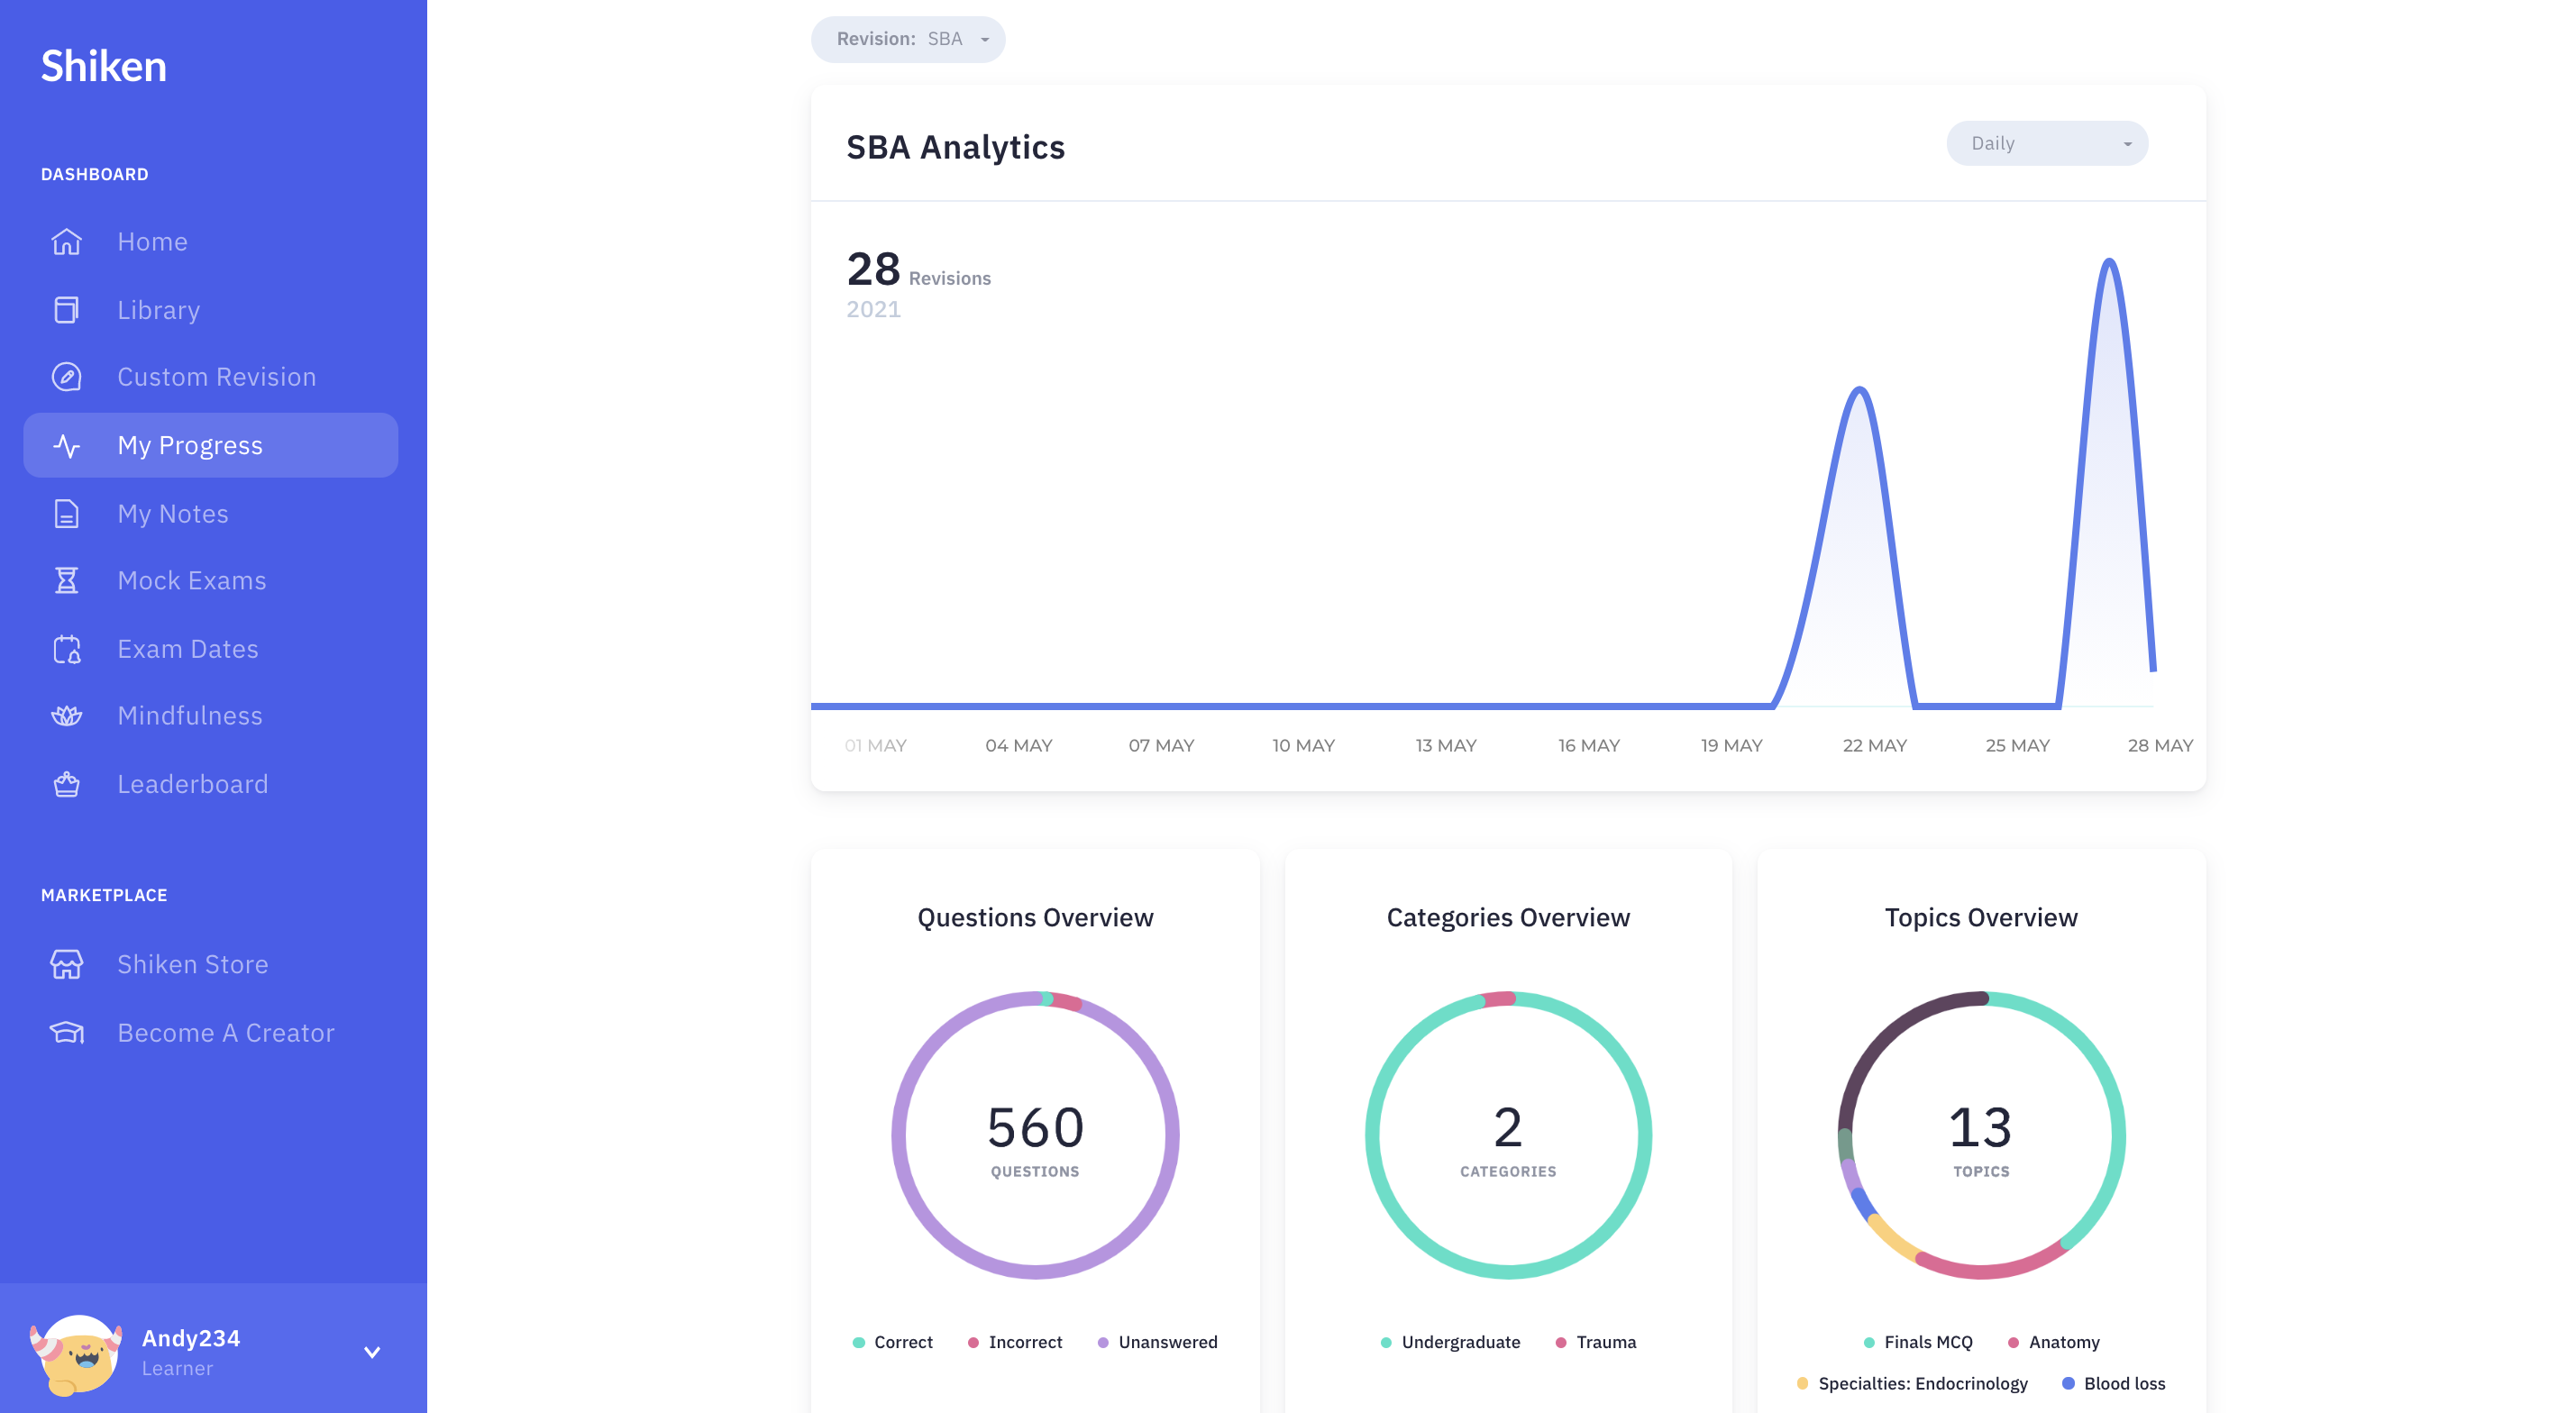
When entering the progress area you can view overview charts of your progress in learning and mindfulness. By clicking on either of the chart headings you can deep dive into more specific analytics. You can also dynamically adjust the date range of the graphs by clicking on the Daily dropdown.
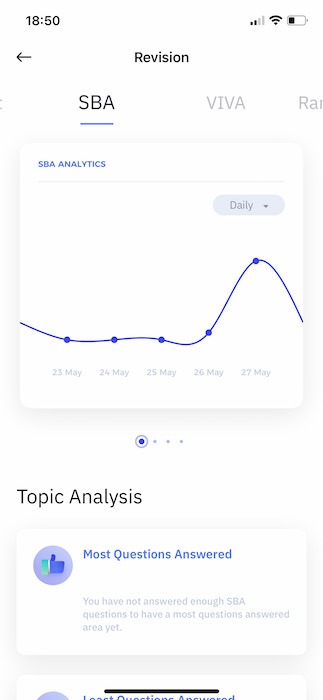
Revision/learning analytics are divided by question type which can be horizontally scrolled through.
For each question type progress graphs are scrollable and breakdown by comparisons with time, completion, subjects and categories.
In addition personalised analytics will breakdown a variety of data including which topics and areas you are strongest and weakest in.
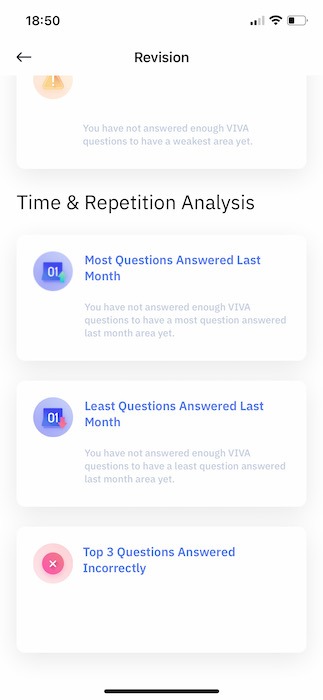
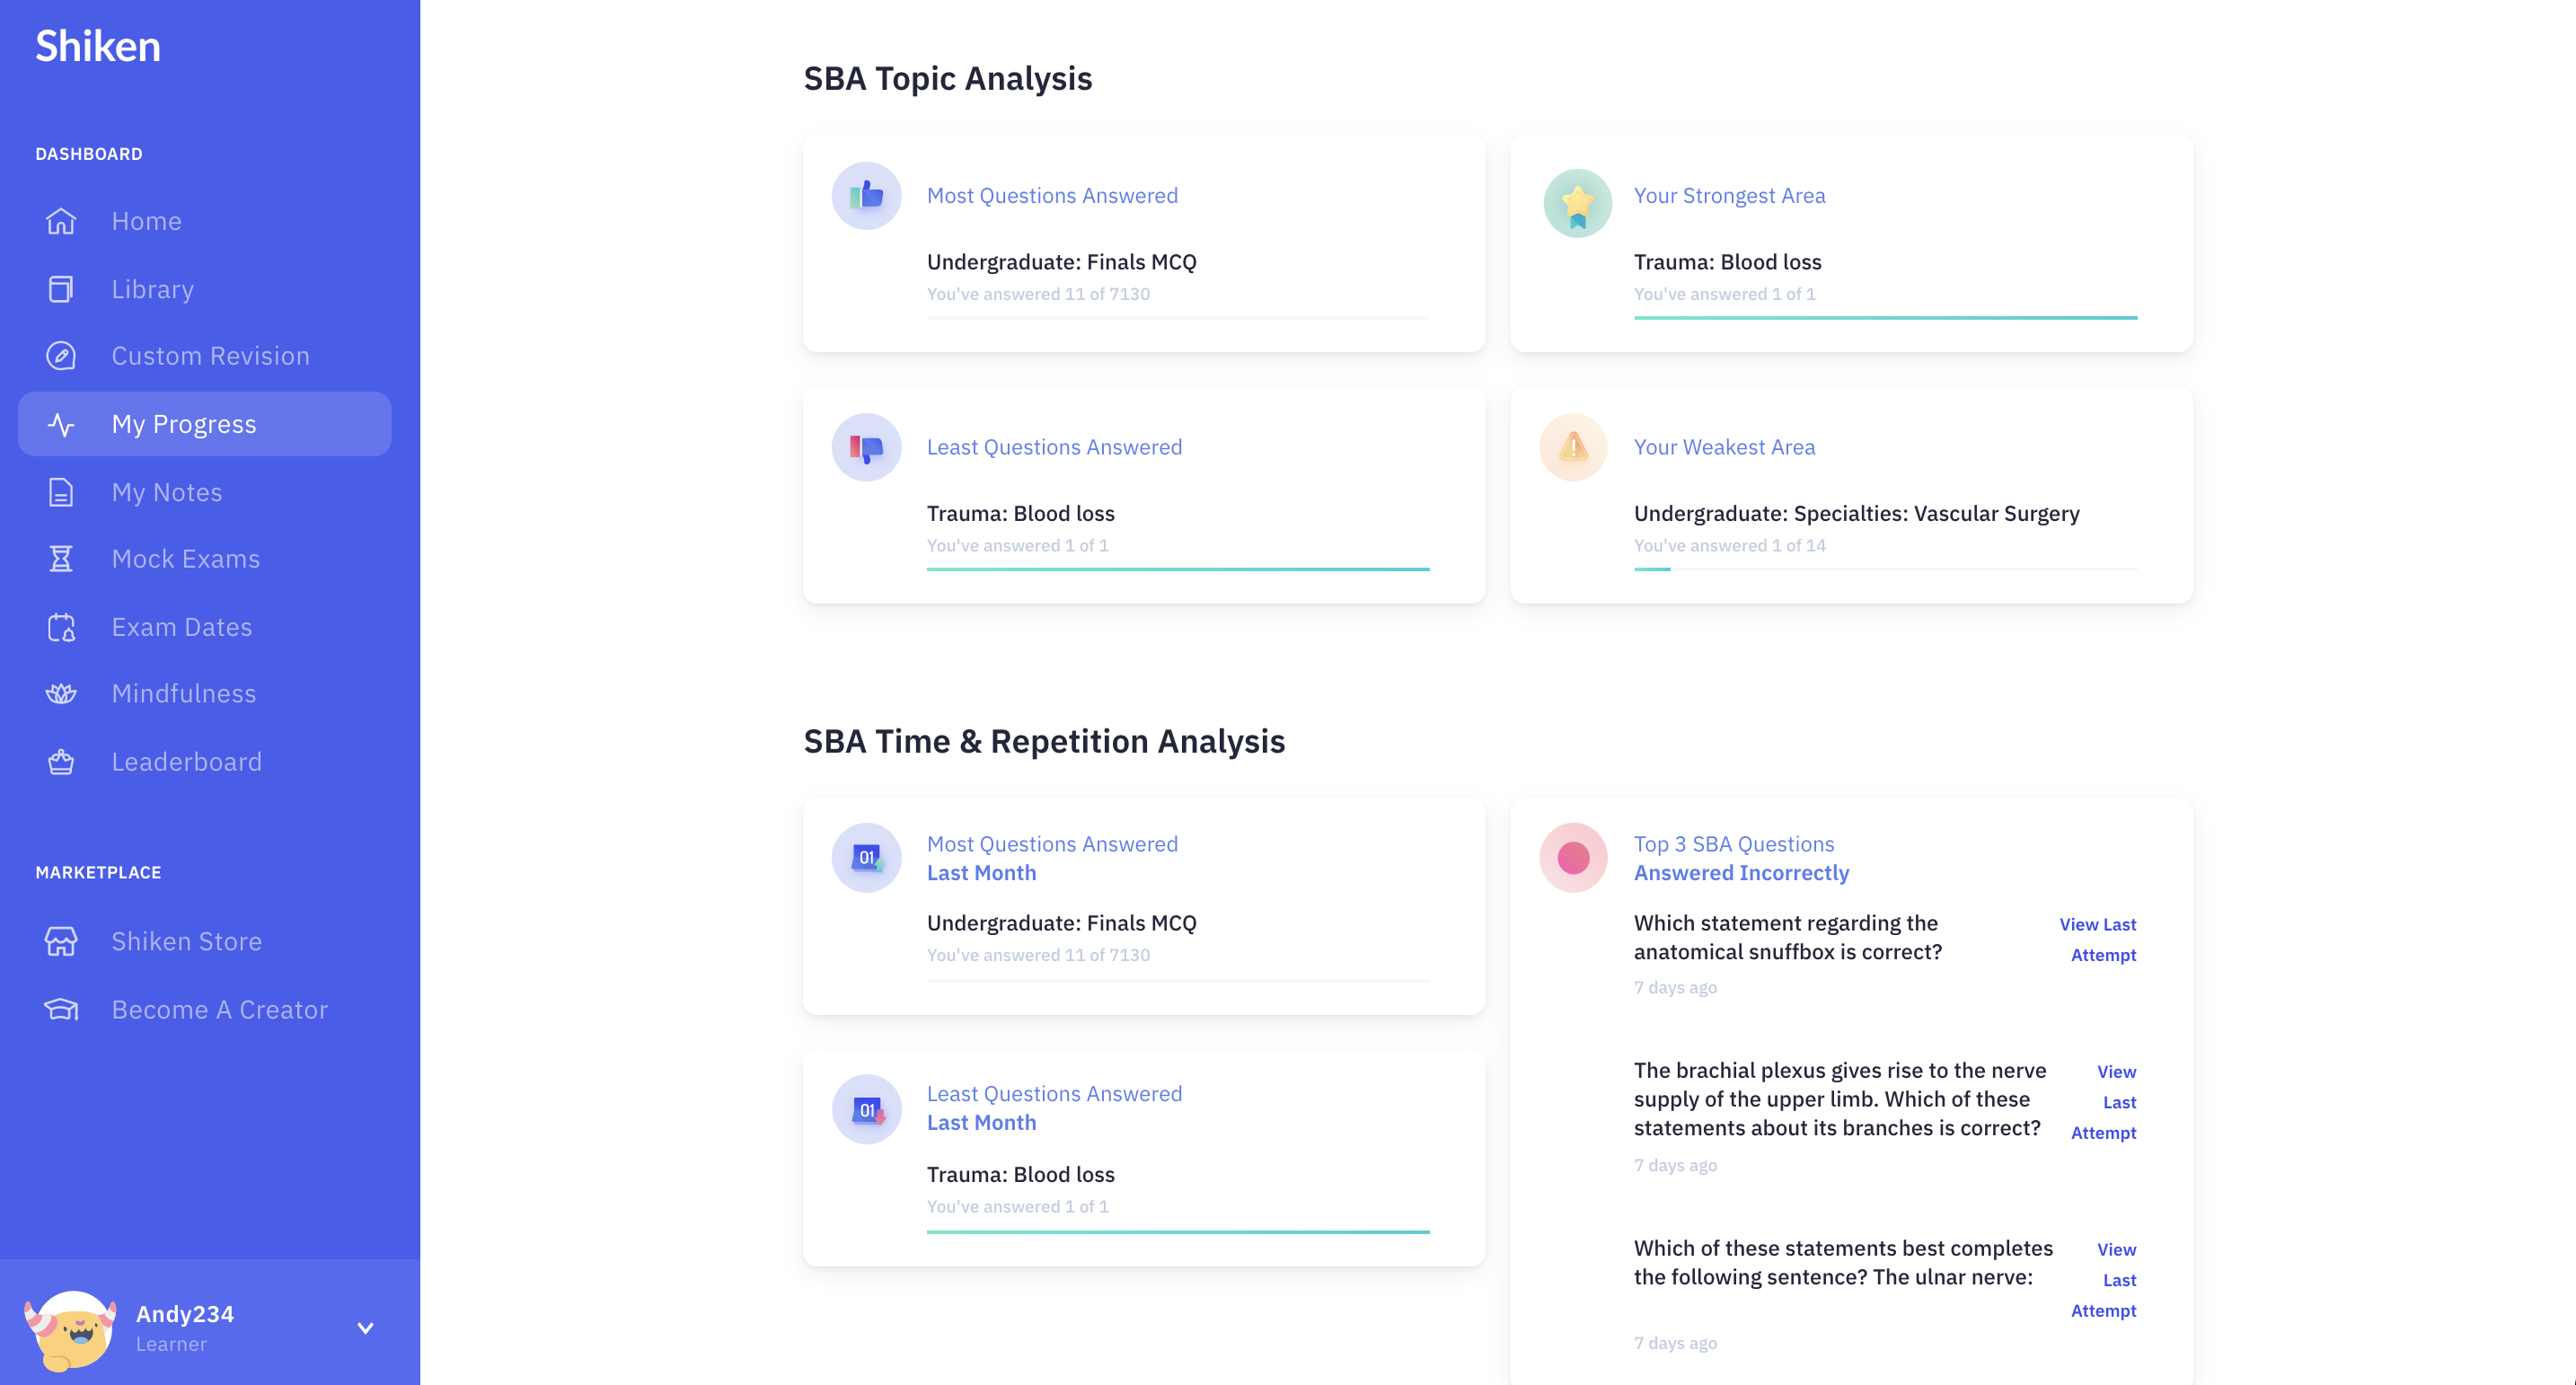
Once you have completed sufficient questions the platform will also calculate key questions you might be struggling with.
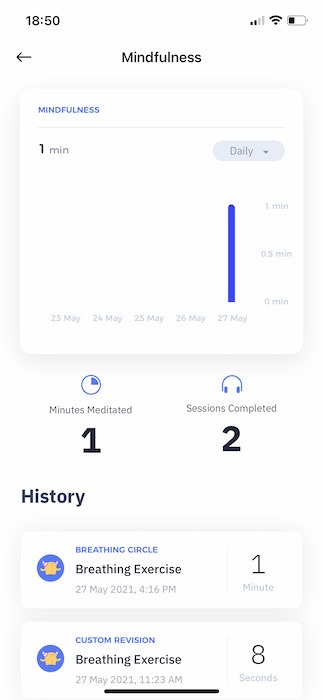
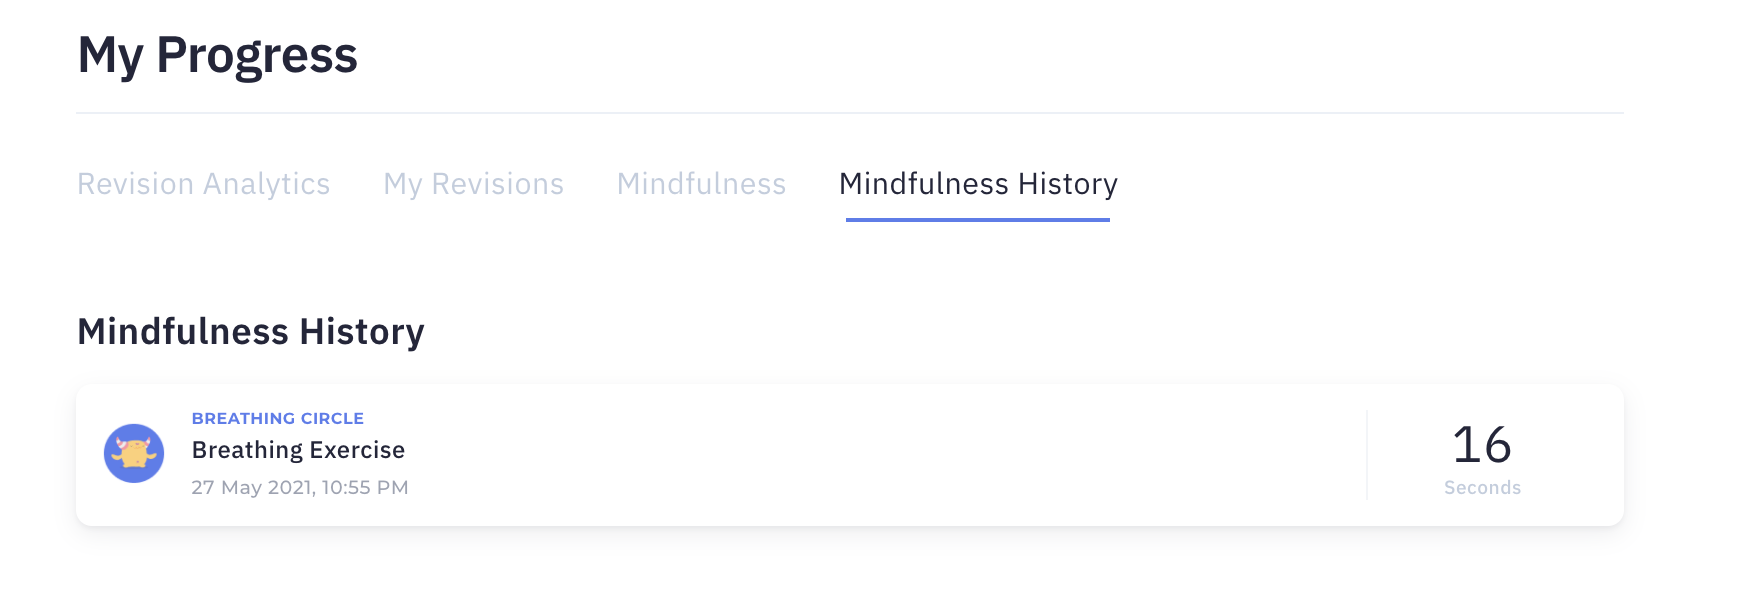
The mindfulness progress analytics show your total mindful minutes, number of mindfulness sessions completed, your mindful minutes by day/month/year together with breakdowns of individual mindful sessions in the history section.
Product analytics are housed in the Library rather than in the progress area. Product analytics provide a breakdown of progress within a product, product-specific leaderboards and historic learning sessions from where you can jump in and review questions and your answers.